

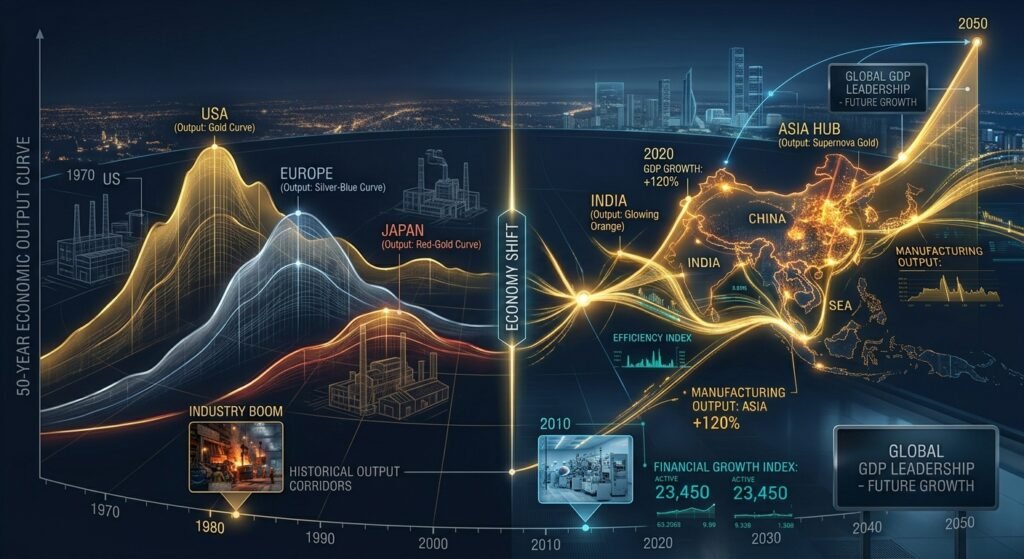
Evaluating global macroeconomic trends across decades highlights an unmistakable realignment of capital, industrial productivity, and trade power. Five decades ago, global GDP was predominantly concentrated across Western Europe and North America. However, analyzing how global wealth has shifted over the last 50 years reveals a dramatic structural transition: the re-emergence of Asia as a primary industrial engine, the rise of sovereign wealth investment, and the transformation of Western economies into technology- and services-dominated markets.
Understanding these multi-decade shifts provides crucial context for evaluating modern trade corridors, foreign direct investment (FDI) movements, and currency reserve dynamics.
Key Takeaways
- The Great Re-Centering: The center of global economic gravity has progressively moved east, driven by fast-paced industrial expansion across East and South Asia.
- Western Sector Evolution: North American and Western European economies shifted from traditional heavy manufacturing toward high-margin technology, intellectual property, and institutional capital management.
- Commodity Petrodollar Growth: Energy-exporting states transformed primary resource revenues into sovereign wealth funds to finance long-term diversification.
- Purchasing Power Realignment: Cost-adjusted production metrics (PPP) highlight emerging economies acquiring a dominant share of total world output.
Macro Trends Over the Decades (1970s – 2020s)
Analyzing historical GDP trajectory records compiled by international research bodies, such as the [External Link: Official World Bank Open Data Portal], illustrates how economic output expanded and redistributed:
Historical GDP Share Shift (Top Nations Comparison)
Below is an overview of how top national economies transitioned across key historical markers over the last half-century:
| Era | Top 3 Nominal Economies | Core Drivers of Economic Activity | Primary Macro Factors |
| 1970s | United States, Soviet Union, Germany | Heavy Industrial Output, Manufacturing, Energy | Post-WWII industrial infrastructure, Bretton Woods transition |
| 1990s | United States, Japan, Germany | Electronics, Automotive Manufacturing, Globalized Trade | Japanese asset boom, European integration, market liberalization |
| 2010s | United States, China, Japan | Export Manufacturing, Infrastructure Buildouts, Global Tech | WTO integration, rapid urbanization, rising trade volume |
| 2020s+ | United States, China, Germany / India | Digital Platforms, Microchips, Green Energy, Advanced Services | Supply chain diversification, automation, capital depth |
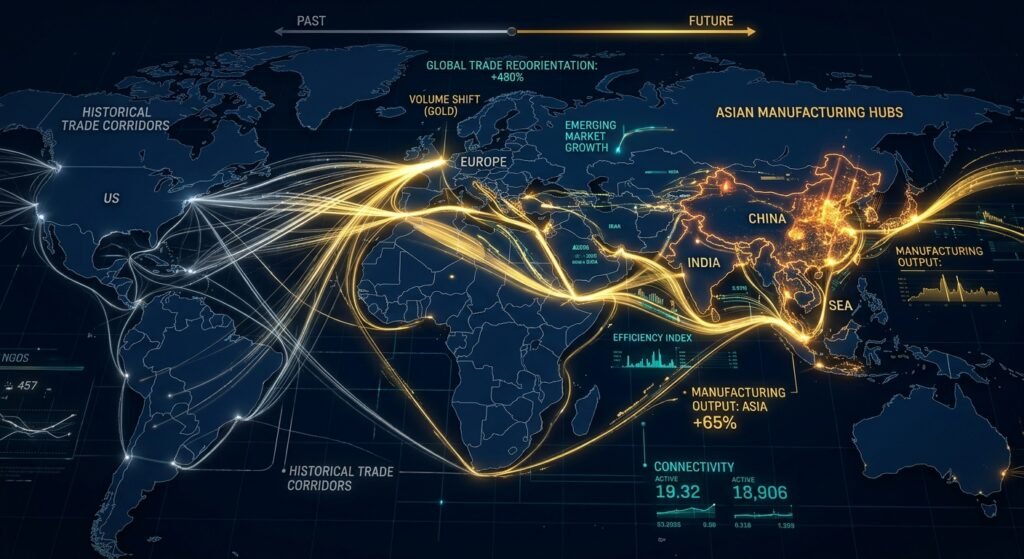
Core Structural Drivers of the Global Wealth Shift
Analyzing how global wealth has shifted over the last 50 years requires examining three structural growth engines:
1. The Global Manufacturing Transfer
Beginning in the late 20th century, Western corporations relocated capital-intensive labor operations to cost-effective coastal Asian jurisdictions. This capital inflow transformed East Asia into an international supply hub, accelerating national GDP growth rates across China, South Korea, and Southeast Asia.
2. Service Financialization and Tech Concentration
As manufacturing shifted geographically, Western economies pivoted toward private capital markets, software innovation, and specialized services. The United States leveraged venture liquidity and currency reserve status to build massive tech and financial sector valuations.
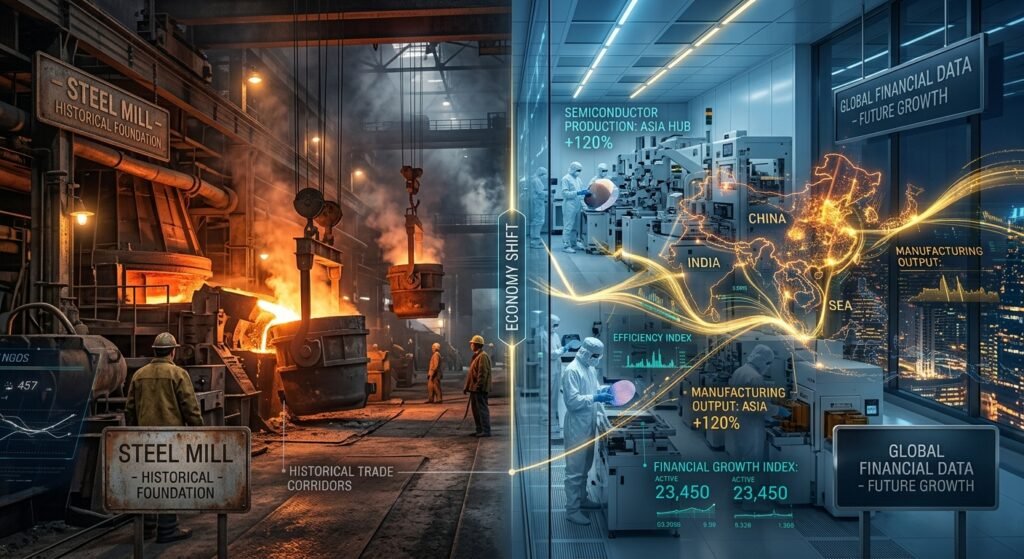
Modern Distribution: Nominal Output vs. Purchasing Power
A major development over the past 50 years is the divergence between nominal GDP and Purchasing Power Parity (PPP). While nominal metrics continue to show strong US dollar valuations, PPP metrics highlight how emerging markets account for a substantial portion of real, physical output volume.
- Nominal Wealth: Capital remains heavily concentrated in nations with liquid financial exchanges and strong reserve currencies.
- Purchasing Power (PPP): Real manufacturing and domestic goods volume has increasingly gravitated toward high-population developing nations.
Conclusion
Reviewing how global wealth has shifted over the last 50 years demonstrates the dynamic nature of international economic rank. From post-war manufacturing dominance to modern digital service hubs and Asian supply networks, global economic leadership relies on continuous adaptability, technical innovation, and capital investment.
For a deeper dive into current national rankings, explore our detailed breakdown on the [Internal Link: Top Countries in the World by Nominal GDP].
Frequently Asked Questions (FAQs)
What is the focus keyword of this historical economic review?
The core focus keyword analyzed throughout this report is how global wealth has shifted over the last 50 years, examining multi-decade capital movements and GDP trends.
Which region experienced the fastest economic expansion over the last 50 years?
East and South Asia recorded the fastest average growth rates, driven by rapid industrialization, high export expansion, and infrastructure buildouts across China, South Korea, and India.
Why did Western economies transition from manufacturing to services?
Rising domestic labor costs and globalization prompted Western nations to shift lower-margin assembly operations overseas, while focusing internal capital on higher-margin software, biotechnology, and financial services.
How do petrodollar reserves impact global wealth distribution?
Energy-rich states in the Middle East convert fossil fuel revenues into sovereign wealth investment portfolios, allowing them to acquire substantial global real estate, technology, and equity holdings.
1 thought on “Historical Ranking: How Global Wealth Has Shifted Over the Last 50 Years”